The planetary spectra collection is a compilation of telescopic spectra of the main Solar System objects acquired in various conditions from different instruments – some historical, some more recent. Its primary purpose is to provide quick and easy references to observers, in particular in an educative context.
Virtual Observatory service
Publicly available datasets have been identified, and a Virtual Observatory (VO) data service has been setup to provide easier access to this spectral library.
The library is presented in a table with descriptive parameters for each spectrum:
– Observing conditions have been retrieved from the original papers when possible
– Bibliographic references are included as bibcode (used by ADS)
– Except in a few obvious cases, no spectrum has been removed from the original data collections. Comments about data quality are given below
– Each line links to a single data product
– Thumbnails have been produced to provide a quick visual diagnostic in the search interface
Most spectra are provided in two versions:
– All spectra are available in VOtable format, which can be handled by VO tools
– The spectral axis is converted to wavelength in µm when required
– The data are not recalibrated, in particular the original “flux” axis is preserved. This is not homogeneous in the library (i.e., some spectra are in flux or radiance, some are in reflectance or albedo, some are normalized, etc)
– As a reference, a link to the original version is also provided (native formats may be difficult to read)
The table is formatted according to the EPN-TAP standard. The data service can be queried using the TAP protocol, in particular from the VESPA portal of Solar System data: http://vespa.obspm.fr/
See the complete data service in the VESPA portal (schema name is spectro_planets)
A tutorial for spectral studies in the Planetary Science VO context is available here:
http://voparis-europlanet.obspm.fr/utilities/Tuto_Spectro_VESPA.pdf
In particular with the CASSIS tool:
http://voparis-europlanet.obspm.fr/utilities/Tuto_CASSIS_VESPA.pdf
In short: you first identify data of interest from a search interface, then send selected results in a visualization and analysis tool. The plotting tool of choice is CASSIS, but TOPCAT and SPLAT-VO are also convenient.
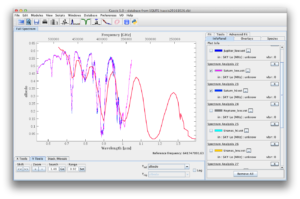
Fig.1: Clark & McCord (low-resolution) vs Karkoschka spectra of Saturn scaled in CASSIS
Looking for spectra
Searches can be performed from the VESPA portal or any TAP interface (TAPhandle, TOPCAT, etc). A specific EPN-TAP client is also installed in the CASSIS spectral tool.
Query results are tables, with a line describing each match. The column access_url provides a link to the spectrum.
Important search parameters include:
target_name – standard name of the objet, IAU spelling
spectral_range_min / spectral_range_max – limits of the spectral range (given in Hz in the table)
spectral_resolution_min / spectral_resolution_max – provides of rough idea of FWHM
measurement_type – measured quantity provided as a UCD
data_calibration_desc – contains similar information as a free format comment
access_format – distinguishes from VOtable and native formats (also mentioned in granule_uid)
granule_gid – a code indicating the origin of the data
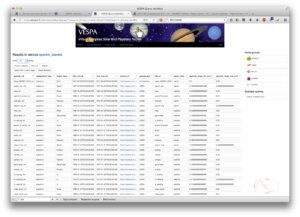
Fig.2: the planetary spectral library in the VESPA search interface (result from a global query)
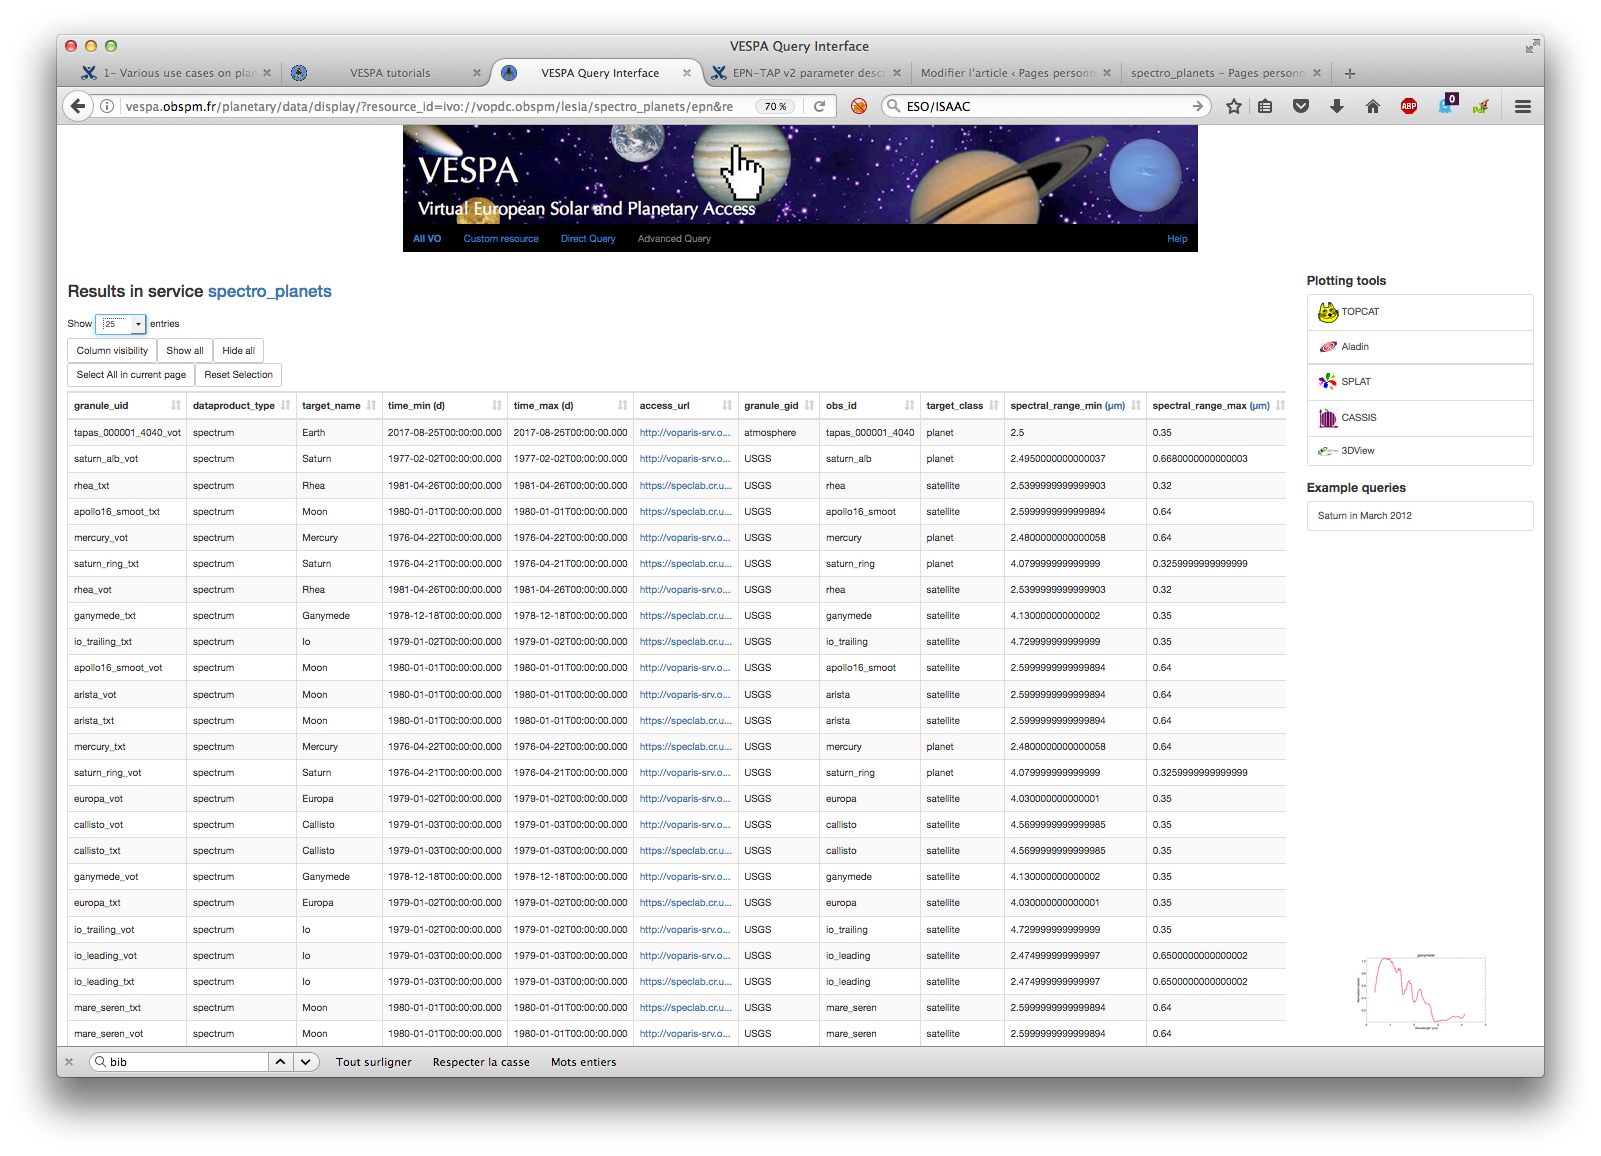
Standard queries to find spectra of interest
The VESPA portal allows the user to issue requests from a graphical interface. It will query all available data services using the EPN-TAP standard.
Actual TAP queries can also be issued from lower-level interfaces using the ADQL language.
Such detailed queries can be performed in Advanced Query Mode or in Direct Query Mode from the VESPA portal, as well as from TOPCAT or TAPhandle.
• The initial clause of the TAP query is always
SELECT * from spectro_planets.epn_core
• Simple filters on the search parameters are attached to it, e.g.:
where target_name = ‘Callisto’
will retrieve all Callisto data
where granule_gid like ‘%USGS%’
will retrieve all spectra from the USGS collection
where target_name like ‘%Callisto%’ and granule_uid like ‘%_vot%’
where target_name like ‘%Callisto%’ and access_format like ‘%votable%’
both will retrieve only VOtable versions
Data included
Several collections of spectra distributed on web sites were gathered.
The original data calibration is preserved, and data are provided either as flux, radiance, or reflectance/albedo, and are sometimes normalized. Scaling is indicated in the parameter data_calibration_desc.
The spectral axis is always wavelength in µm (except for the transmission spectrum).
• The USGS dataset is a set of historical spectra measured from Mauna Kea by the McCord & Clark team in the late 70’s. Some of these are actually composites from several sources.
Original files are distributed on the USGS site (https://speclab.cr.usgs.gov/planetary.spectra/planetary-sp.html), and were apparently digitized manually.
The two Mars spectra provided on this page are notoriously affected by a severe scanning error and are offset in wavelength; they are not included in the current data service.
Other spectra were checked to be consistent with the original publications, but may be affected by shortcomings related to pioneering instrumentation of that time. Later comments from the observers are included in the header of the original files.
– The spectrum of Mercury in particular is affected by strong artifacts: “The spectra near 1.4 and 1.9 microns have residual telluric water absorptions. The thermal emission component has been removed. The feature near 2.3 microns is probably not real.”
– The two Io spectra are calibrated to the Moon, which may result in an overall blue spectral slope.
• The IRTF dataset is extracted from a stellar spectra library distributed on the IRTF site: http://irtfweb.ifa.hawaii.edu/~spex/IRTF_Spectral_Library/index_files/All.html
These data are absolutely calibrated in flux.
The original fits files are not compatible with VO access and where reformatted as VOtable.
• The ESO-JSNU dataset is from Karkoschka 1998 and is distributed by the PDS Atmosphere node:
http://atmos.nmsu.edu/pdsd/archive/data/eso-jsnu-spectrophotometer-4-v20/gbat_0001/
The original data are stored in tables which are split into individual spectra for the VOtable version. Both low and high resolution are included, because the lower resolution version encompasses a broader spectral range. Data from Karkoschka 1994 are retained to be of lesser quality and are not included.
– The given spectrum for Saturn refers to the case of Saturn without rings, an extrapolation from the small ring tilt during the observations to 0° ring tilt.
• The THN-PSL library from Lundock et al 2009 is distributed in VizieR (CDS, Strasbourg). The original version from the instrument has been converted to VOtable, and is oversampled. A binned version (3-point box average) is also included in the original dataset.
Although this is an interesting effort to provide a consistent set of spectra of all the major Solar System objects, these data are of varying quality and must be used with caution.
• Comments from the paper:
– The instrument uses three separated beams: one optical channel (0.45−0.90 μm) and two infrared channels IR1 (0.90−1.85 μm) and IR2 (1.85−2.5 μm)
– Shorter than 0.47 μm and between 0.9 and 1.0 μm the spectra are not reliable because of the dichroic coating problem with the beam splitters
– Around 1.4 and 1.8 μm, Earth’s atmosphere has strong water absorption bands, where the signal quality is low.
• Additional evaluation:
– Telluric absorptions are sometimes present also around 1.15 µm
– “Beam” extremities at 0.97-1.0 µm and 1.83-1.87 µm: some channels were set to zero in the original files; they are removed from the VOtable version for clarity
– The level measured in these border regions is often suspicious (e.g., blue slope in the upper part of the visible range, or very low level in the 0.9-1.0 µm range)
– The visible range is sometimes affected by a calibration issue centered around 0.7 µm; something equivalent may occurs also in the NIR range
– The only Mars spectrum was obviously saturated in many places, and has been removed
– Lunar spectra also need to be used with caution
• The LESIA dataset contains two composite spectra of Mars representative of dark and bright regions, intended to replace the dubious spectra filtered from other datasets. They are composited from ISM/Phobos-2 (1989) and IRS/Mariner-7 (1969) observations, and enlarged to the visible range with Maunea Kea CCD spectra (1988). Thermal emission is removed from the measured flux (would becomes noticeable longward of 3.3 µm). The peak at 4.2 µm in the Margaritifer (dark) spectrum is probably an artifact from the thermal emission correction.
A more recent spectrum of Mercury (2006) is also included, in this case with thermal emission still present. This corresponds to a ~ 500 km region in the southern hemisphere.
• Four standard solar spectra are included to encompass the complete spectral range of the planetary data. They all provide the estimate solar flux at 1 au.
For each spectrum, a VOtable version is included with irradiance converted to W/m^2/µm and spectral axis to wavelength in µm (the original Kurucz spectrum is provided on a wavenumber scale with 1 cm-1 resolution).
These spectra are required to convert from radiance to reflectance: I/F = Radiance / Scaled solar flux / pi
Such a conversion is easily performed in CASSIS for viewing purpose (spectra are resampled on the fly).
Because of normalizations and uncertainty on absolute fluxes of the planets, a scaling factor is usually required.
More information on solar absorptions, including the identification of transitions, is available on the BASS2000 web site (http://bass2000.obspm.fr/solar_spect.php).
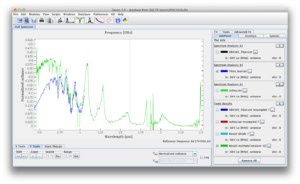
Fig.3: Karkoschka spectrum of Titan (in blue) compared with TNH-PSL spectrum divided by the solar flux from Colina et al 1996. The difference of level in the visible range may be related to different observing conditions.
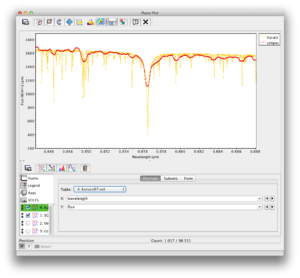
Fig.4: Kurucz and SOLAR-ISS HiRes solar spectra compared in TOPCAT (detail).
• An atmospheric transmission spectrum at similar resolution is also included in the service. Transmission depends very much on observing conditions, this is therefore only intended to identify telluric absorptions, not to correct observational measurements. The spectrum has been computed with the TAPAS on-line service (http://cds-espri.ipsl.fr/tapas/) in the following conditions:
Observatory = Paranal (VLT)
Date of measurement : 2017-08-25T18:28:00
Spectral unit = Vacuum Wavelength (nm)
Spectral range = [360,2490] nm
Instrumental function = Gaussian
Atmospheric model = Average latitude summer
Resolution power = 1000
Sampling ratio = 2
Zenithal angle = 20°
Absorption bands are computed for H2O, O3, O2, CO2, CH4, and NO2. The extinction at short wavelength is from Rayleigh scattering.
The original output from TAPAS is provided (zipped VOtable) with a spectral scale in nm.
• Extra and alternative calibration files are available, e. g., on ESO site
http://www.eso.org/sci/facilities/paranal/decommissioned/isaac/tools.html
• Asteroid spectra are available in other EPN_TAP data services, e.g., spectro_asteroids or M4ast.
Possible extensions
The current data service may be improved by adding more published spectra – contact the helpdesk for comments: support.vespa@obspm.fr
_____________________
This data service is provided in the framework of the VESPA activity in Europlanet 2020 by Paris Astronomical Data Centre (PADC).
The Europlanet 2020 Research Infrastructure project has received funding from the European Union’s Horizon 2020 research and innovation programme under grant agreement No 654208. Additional funding was provided in France by the Action Spécifique Observatoire Virtuel and Programme National de Planétologie / INSU.
![]()