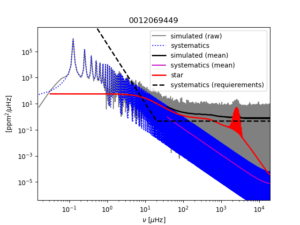
The PLATO Solar-like Light-curve Simulator (PSLS) is Python tool that aims at simulating solar-like oscillators representative of PLATO targets. It includes planetary transits, stochastically-excited oscillations, granulation and activity component (either a « stochastic « component or a spot component), as well as instrumental systematic errors and random noises representative for PLATO.
For more details see PSLS in a nutshell.
If you use this simulator in your research, please cite Samadi et al (2019, A&A, 624, A117). Thanks !
New version 1.9 (02/09/25): 1) correct bug when using stellar grid (HDF5 file) ; 2) mode splittings are now included in more complete way ; 3) save the setup (YAML) in the HDF5 file ; 4) inclusion of flares, based on a prescription established by F. Baudin ; 5) the user can impose any additional stellar component, which is taken from an external TEXT file ; 6) compatibilty issue with numpy.acos() replaced by numpy.arccos()
New version 1.8 (28/01/25): 1) the duration of each quarter has now to be specified (in days); 2) the option –hdf5 saves in a HDF5 file the light-curves (LC) and the various simulation components ; 3) the oscillations, granulation and (stochastic) activity components are now simulated independently ; 4) seed numbers can be controlled independently for the stochastic activity, granulation, and oscillations components ; 5) gaps are introduced ; 6) introduce modulations in the spot radii ; 7) groups of simulated cameras can be specified individually ; 8) the option –proto-sas saves the data in format compatible with the prototype SAS pipeline ; 9) when sampling >25s, the systematic errors were not correctly averaged. For more details Change history.
New version 1.7 (06/09/24): (1) New option « –psd » permits to save the PSD associated with the averaged light-curve (averaged over all cameras). (2) For the granulation component we have now the choice between Kallinger et al (2014)’s model (type=1, the model used so far) or a single Lorentzian component (type=0). (3) The option -M is now working properly. (4) new CESAM2K grid format stored in HDF5 files, the old type of grids can be used provided that ModelType = ‘grid-old’. (5) non-linear limb darkening can be used when 4 coefficients are defined for the parameter LimbDarkeningCoefficients (instead of 2 for a quadratic limb darkening). For more details see Change history
New version 1.6 (29/01/24): I nclusion of a spot model based on Dorren (1987)’s model. Mode properties (frequencies, heights and linewidths) can now be specified with an input TEXT file. For more details see Change history
Caution: this simulator is not an official product of the Plato Mission Consortium (PMC), it is distributed under the terms of the GNU General Public License in the hope that it will be useful, but WITHOUT ANY WARRANTY.

Power spectrum of a simulated solar-like pulsating dwarf star as it would be observed during 2 years by PLATO.